
Free blood pressure log and printable chart
Type in each reading and the log labels it with its American Heart Association category. It works out weekly averages and compares morning with evening, so you have clear numbers to bring to your next appointment. Print it, or keep it on your phone.
| Date | Time | When | Systolic (top) | Diastolic (bottom) | Pulse | Category | Arm | Notes |
|---|---|---|---|---|---|---|---|---|
| Oct 5, 2026 | 7:10 AM | Morning | 134 | 86 | 72 | Stage 1 | Left | Before coffee |
| Oct 5, 2026 | 9:05 PM | Evening | 128 | 82 | 68 | Stage 1 | Left | |
| Oct 6, 2026 | 7:05 AM | Morning | 138 | 88 | 74 | Stage 1 | Left | Slept badly |
| Oct 6, 2026 | 8:50 PM | Evening | 131 | 84 | 70 | Stage 1 | Left | |
| Oct 7, 2026 | 7:15 AM | Morning | 129 | 83 | 71 | Stage 1 | Left | |
| Oct 7, 2026 | 9:20 PM | Evening | 124 | 79 | 66 | Elevated | Left | Walked 30 min after dinner |
| Oct 8, 2026 | 6:55 AM | Morning | 142 | 91 | 76 | Stage 2 | Left | Rushed, measured right after waking |
| Oct 8, 2026 | 7:02 AM | Morning | 136 | 87 | 74 | Stage 1 | Left | Second reading after 5 min rest |
| Oct 8, 2026 | 9:10 PM | Evening | 127 | 81 | 69 | Stage 1 | Left | |
| Oct 9, 2026 | 7:20 AM | Morning | 133 | 85 | 72 | Stage 1 | Left | |
| Oct 9, 2026 | 9:00 PM | Evening | 126 | 80 | 67 | Stage 1 | Left | |
| Oct 10, 2026 | 8:30 AM | Morning | 130 | 84 | 70 | Stage 1 | Left | Weekend, slept in |
| Oct 10, 2026 | 9:40 PM | Evening | 122 | 78 | 66 | Elevated | Left | |
| Oct 11, 2026 | 8:45 AM | Morning | 128 | 82 | 69 | Stage 1 | Left | |
| Oct 11, 2026 | 9:15 PM | Evening | 121 | 77 | 65 | Elevated | Left | Relaxed evening |
| Oct 12, 2026 | 7:10 AM | Morning | 131 | 83 | 71 | Stage 1 | Left | |
| Oct 12, 2026 | 9:00 PM | Evening | 125 | 79 | 67 | Elevated | Left | |
| Oct 13, 2026 | 7:05 AM | Morning | 127 | 81 | 70 | Stage 1 | Left | |
| Oct 13, 2026 | 8:55 PM | Evening | 118 | 76 | 64 | Normal | Left | After evening walk |
| Oct 14, 2026 | 7:15 AM | Morning | 129 | 82 | 71 | Stage 1 | Left | |
| Oct 14, 2026 | 9:05 PM | Evening | 123 | 78 | 66 | Elevated | Left |
| Week of | Readings | Avg systolic | Avg diastolic | Avg pulse | Category of average | Systolic change |
|---|---|---|---|---|---|---|
| Oct 5, 2026 | 15 | 130 | 83 | 70 | Stage 1 | |
| Oct 12, 2026 | 6 | 126 | 80 | 68 | Stage 1 | -4 |
| Oct 19, 2026 | 0 | |||||
| Oct 26, 2026 | 0 | |||||
| Nov 2, 2026 | 0 | |||||
| Nov 9, 2026 | 0 | |||||
| Nov 16, 2026 | 0 | |||||
| Nov 23, 2026 | 0 |
| Group | Readings | Systolic | Diastolic | Pulse |
|---|---|---|---|---|
| All readings | 21 | 129 | 82 | 69 |
| Morning readings | 11 | 132 | 85 | 72 |
| Evening readings | 10 | 125 | 79 | 67 |
| Highest | 142 | 91 | 76 | |
| Lowest | 118 | 76 | 64 | |
| Category of your average | Stage 1 |
| Category | Systolic (top) | Diastolic (bottom) | Your readings | Share |
|---|---|---|---|---|
| Normal | Under 120 | and under 80 | 1 | 4.8% |
| Elevated | 120 to 129 | and under 80 | 5 | 23.8% |
| Stage 1 | 130 to 139 | or 80 to 89 | 14 | 66.7% |
| Stage 2 | 140 or higher | or 90 or higher | 1 | 4.8% |
| Crisis: call doctor | Higher than 180 | and/or higher than 120 | 0 | 0% |
What's inside
- A reading log with date, time, systolic, diastolic, pulse, arm and notes
- Every reading labeled Normal, Elevated, Stage 1, Stage 2 or Crisis using the American Heart Association ranges
- Weekly averages with the change in your top number from the week before
- Morning vs evening averages, plus your highest and lowest readings
- A count of how many readings fall in each category
- Prints cleanly for your doctor, and works in Google Sheets and Excel
How to use it
Make your copy
Click "Make a copy" to save the log to your Google Drive, or download the Excel file. Delete the sample readings when you're ready to start.
Measure the same way each time
Sit quietly for 5 minutes first, feet flat, arm resting at heart level. Use the same arm each time and note it in the Arm column.
Add each reading
Type the date, the time and the three numbers from your monitor. The When and Category columns fill in by themselves.
Set the first week
On Weekly Averages, change the first Week of date to the Monday your log starts. The weeks below follow on from it.
Share it with your doctor
Before an appointment, print the BP Log and Weekly Averages tabs, or share the sheet. Your doctor can see the pattern, not just one reading in the office.
Tips
Take two readings, a minute apart
Many doctors ask for two readings each time. Log both. If the first is much higher, a note helps explain it.
Measure at the same times each day
Morning before coffee or medication, and again in the evening, is a common routine. It makes the morning vs evening averages useful.
Use notes for context
Poor sleep, stress, caffeine, a missed dose or a workout can all shift a reading. A few words now saves trying to remember later.
Don't change medication on your own
If your numbers change, talk to your doctor before changing anything. This log is a record to share, not a diagnosis.
Questions
What are the blood pressure categories?
The American Heart Association uses Normal (under 120 and under 80), Elevated (120 to 129 and under 80), Stage 1 (130 to 139 or 80 to 89) and Stage 2 (140 or higher or 90 or higher). The Categories tab shows the ranges and how many of your readings fall in each.
What if a reading is over 180/120?
The log labels it "Crisis: call doctor". The AHA says to wait a few minutes and measure again, and if it's still that high, contact your doctor right away. If you also have symptoms like chest pain, shortness of breath, weakness or trouble seeing or speaking, call 911.
Is this medical advice?
No. The log only sorts your numbers into the published AHA ranges. Your doctor decides what your readings mean for you, so share the log with them.
How often should I take my blood pressure?
Ask your doctor. A common routine is twice a day, morning and evening, for a week or two before an appointment. The log works with any routine.
Can I print it?
Yes. In Google Sheets go to File > Print and pick the tab you want. In Excel, download the file and print from there.
Is it free?
Yes. Copy it to your Google Drive or download the Excel file. No sign-up, and your readings stay in your own file.
Pro version
Blood Pressure Log Pro
A blood pressure log that works out your averages, charts the trend and prints a one-page report for your doctor.
Type each reading once
Add the date, time and your two numbers on the Log. Morning or evening and the American Heart Association category fill themselves in.
See your averages
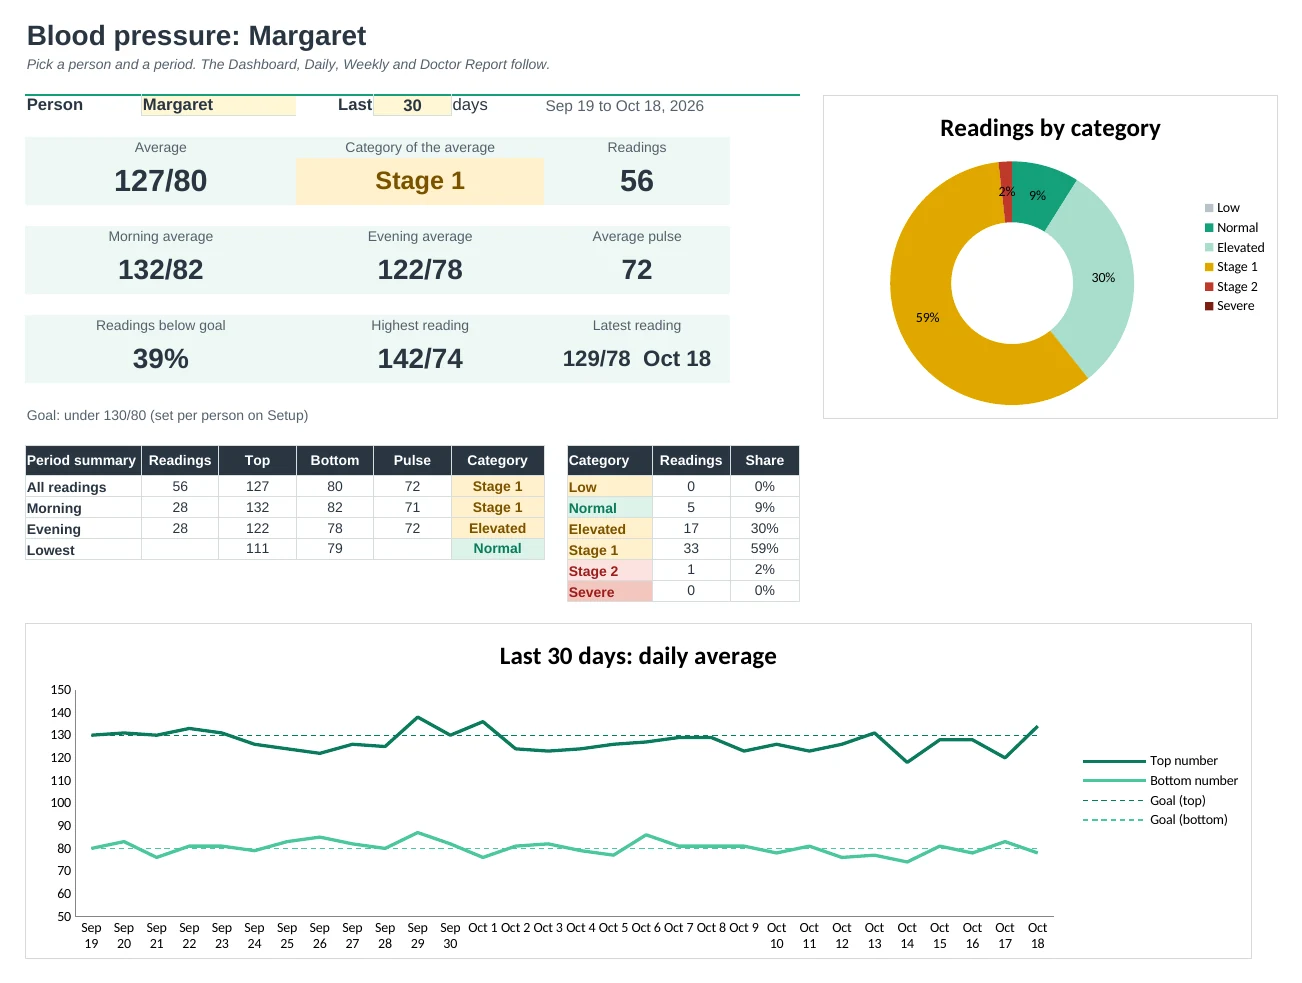
Pick 7, 14, 30 or 90 days. The Dashboard shows your average, morning vs evening, pulse, highest reading and how many readings were below your goal.
Watch the trend
A 30-day chart and 13 weeks of weekly averages, each with your goal marked, so one high reading doesn't hide the bigger picture.
Bring a report to your appointment
Doctor Report prints on one page: averages, categories, the last 14 days, a chart and your notes and questions.
Track the whole household
Add up to 6 people, each with their own goal and doctor. Pick a name and every view switches to them.
Big, clear and simple
Large numbers, colour-coded categories and dropdowns for who, arm and tags like Before meds or Stressed. Works in Google Sheets and Excel.
| Free | Pro |
|---|---|
| One log for one person | Up to 6 people, each with their own goal |
| Weekly averages | Averages for any period: 7 to 365 days |
| Morning vs evening summary | Morning, evening, highest, lowest and below-goal share |
| · | Dashboard with a 30-day trend chart and category chart |
| · | Daily view: morning and evening side by side |
| · | Printable one-page doctor report |
| · | Tags and notes for context (missed dose, coffee, stress) |
$19 one-time
7 tabs: Start Here, Dashboard, Log, Daily, Weekly, Doctor Report and Setup. You get two copies: one filled in with three months of sample readings so you can see it working, and a blank one ready for your own. It's a record to share with your doctor, not medical advice.
Get Blood Pressure Log Pro for $19- Instant download after checkout
- Works in Google Sheets and Excel
- Yours to keep and reuse every year