
Free Gantt chart template for Google Sheets
List your project's tasks with a start and end date, and the chart fills in a bar for every week each task runs. Change a date and the bars move. It also counts workdays, flags late tasks and shows how far along the whole project is.
| Task | Phase | Owner | Start | End | Workdays | Done | Status | W1 | W2 | W3 | W4 | W5 | W6 | W7 | W8 | W9 | W10 | W11 | W12 |
|---|---|---|---|---|---|---|---|---|---|---|---|---|---|---|---|---|---|---|---|
| Week of | 11/2 | 11/9 | 11/16 | 11/23 | 11/30 | 12/7 | 12/14 | 12/21 | 12/28 | 1/4 | 1/11 | 1/18 | |||||||
| Kickoff meeting | Plan | Dana | Nov 2, 2026 | Nov 2, 2026 | 1 | 100% | Done | ◆ | |||||||||||
| Gather requirements | Plan | Dana | Nov 2, 2026 | Nov 6, 2026 | 5 | 100% | Done | ■ | |||||||||||
| Site map and content plan | Plan | Priya | Nov 9, 2026 | Nov 13, 2026 | 5 | 100% | Done | ■ | |||||||||||
| Wireframes | Design | Marcus | Nov 16, 2026 | Nov 25, 2026 | 8 | 80% | Late | ■ | ■ | ||||||||||
| Visual design | Design | Marcus | Nov 23, 2026 | Dec 4, 2026 | 10 | 40% | In progress | ■ | ■ | ||||||||||
| Design sign-off | Design | Dana | Dec 4, 2026 | Dec 4, 2026 | 1 | 0% | Not started | ◆ | |||||||||||
| Front-end build | Build | Leo | Dec 7, 2026 | Dec 23, 2026 | 13 | 0% | Not started | ■ | ■ | ■ | |||||||||
| CMS setup | Build | Leo | Dec 7, 2026 | Dec 18, 2026 | 10 | 0% | Not started | ■ | ■ | ||||||||||
| Write and load content | Build | Priya | Dec 14, 2026 | Jan 8, 2027 | 20 | 0% | Not started | ■ | ■ | ■ | ■ | ||||||||
| QA testing | Test | Priya | Jan 4, 2027 | Jan 13, 2027 | 8 | 0% | Not started | ■ | ■ | ||||||||||
| Fix bugs | Test | Leo | Jan 11, 2027 | Jan 15, 2027 | 5 | 0% | Not started | ■ | |||||||||||
| Client review | Test | Dana | Jan 14, 2027 | Jan 18, 2027 | 3 | 0% | Not started | ■ | ■ | ||||||||||
| Launch day | Launch | Leo | Jan 20, 2027 | Jan 20, 2027 | 1 | 0% | Not started | ◆ | |||||||||||
| Post-launch checks | Launch | Priya | Jan 20, 2027 | Jan 22, 2027 | 3 | 0% | Not started | ■ |
| Item | Value | Notes |
|---|---|---|
| Today's date | Nov 30, 2026 | Type a new date, or =TODAY() to keep it current |
| Chart starts (week of) | Nov 2, 2026 | The Monday of your first task's week. Type a date to start the chart somewhere else |
| Project start | Nov 2, 2026 | |
| Project finish | Jan 22, 2027 | |
| Workdays start to finish | 60 | Mondays to Fridays, holidays not taken out |
| Workdays left | 40 | |
| Tasks | 14 | |
| Done | 3 | |
| In progress | 1 | |
| Late | 1 | Past the end date and not at 100% |
| Overall progress | 23% | Each task's Done % weighted by its workdays |
| Phase | Tasks | Done | Late | Workdays | Progress |
|---|---|---|---|---|---|
| Plan | 3 | 3 | 0 | 11 | 100% |
| Design | 3 | 0 | 1 | 19 | 54.7% |
| Build | 3 | 0 | 0 | 43 | 0% |
| Test | 3 | 0 | 0 | 16 | 0% |
| Launch | 2 | 0 | 0 | 4 | 0% |
| All phases | 14 | 3 | 1 | 93 | 23% |
What's inside
- A 12-week bar grid built from formulas, so bars move when you change a date
- One-day tasks show as a diamond, so milestones like sign-off and launch stand out
- Workdays per task, worked out for you (Monday to Friday)
- Status for every task: Not started, In progress, Late or Done
- A summary with project start, finish, workdays left and overall progress, plus totals by phase
- No add-ons or charts to set up, and it works in Google Sheets and Excel
How to use it
Make your copy
Click "Make a copy" to save the template to your Google Drive, or download the Excel file. The sample is a 12-week website project you can type over.
List your tasks
Replace the sample tasks with yours, one per row. Give each a phase, an owner, a start date and an end date. Keep the Week of row at the top.
Set today's date
On the Summary tab, type today's date into Today's date, or enter =TODAY() so it updates by itself. Statuses like Late use this date.
Update progress each week
Change the Done column as work gets finished: 0% for not started, 50% for halfway, 100% for done. The Status column and the summary update.
Read the chart
Each ■ is a week the task runs. Each ◆ is a one-day milestone. The chart starts on the Monday of your first task's week, or on any date you type on the Summary tab.
Add more tasks
Insert rows above Post-launch checks and copy a full row down so the formulas come with it (including the hidden helper column at the end). The summary counts tasks down to row 40.
Tips
Color the bars
Select the week columns, open Format, then Conditional formatting, and set cells equal to ■ to a fill color. The bars turn solid without changing any formulas.
Show more weeks
Copy the last week column to the right. Change the +77 in the copied formulas to +84 for week 13, +91 for week 14, and so on.
Keep tasks a week or two long
Long tasks hide problems. If a task runs more than three weeks, split it into steps you can mark done.
Watch the Late count
A late task early on usually pushes everything after it. Move the later dates as soon as you know, so the chart shows the real plan.
Questions
How do I make a Gantt chart in Google Sheets?
Make a copy of this template and type your tasks with start and end dates. The week columns use a formula that shows a ■ when a week falls between a task's start and end, so the chart builds itself. No add-on or chart setup is needed.
Does Google Sheets have a built-in Gantt chart?
Google Sheets has a timeline view on some paid Workspace plans, but no Gantt chart in the free version. A formula-based grid like this one works in any Google account and in Excel.
Can I use it as a project timeline?
Yes. Each row is a task or milestone, the bars show when it happens, and the Summary tab shows the start, finish and workdays left. That covers what most people need from a simple project timeline.
How do I show days instead of weeks?
Change the +7 steps in the Week of formulas to +1, and change the +6 in the bar formulas to +0. Each column then stands for one day. You will want more columns for a long project.
Does the Workdays column skip holidays?
No. It counts Monday to Friday. In Google Sheets and Excel you can add a list of holiday dates as a third part of NETWORKDAYS if you want them taken out.
Can I use it in Excel?
Yes. Download the .xlsx file. The bars, workdays and statuses all use formulas that work in Excel.
Pro version
Gantt Chart Pro
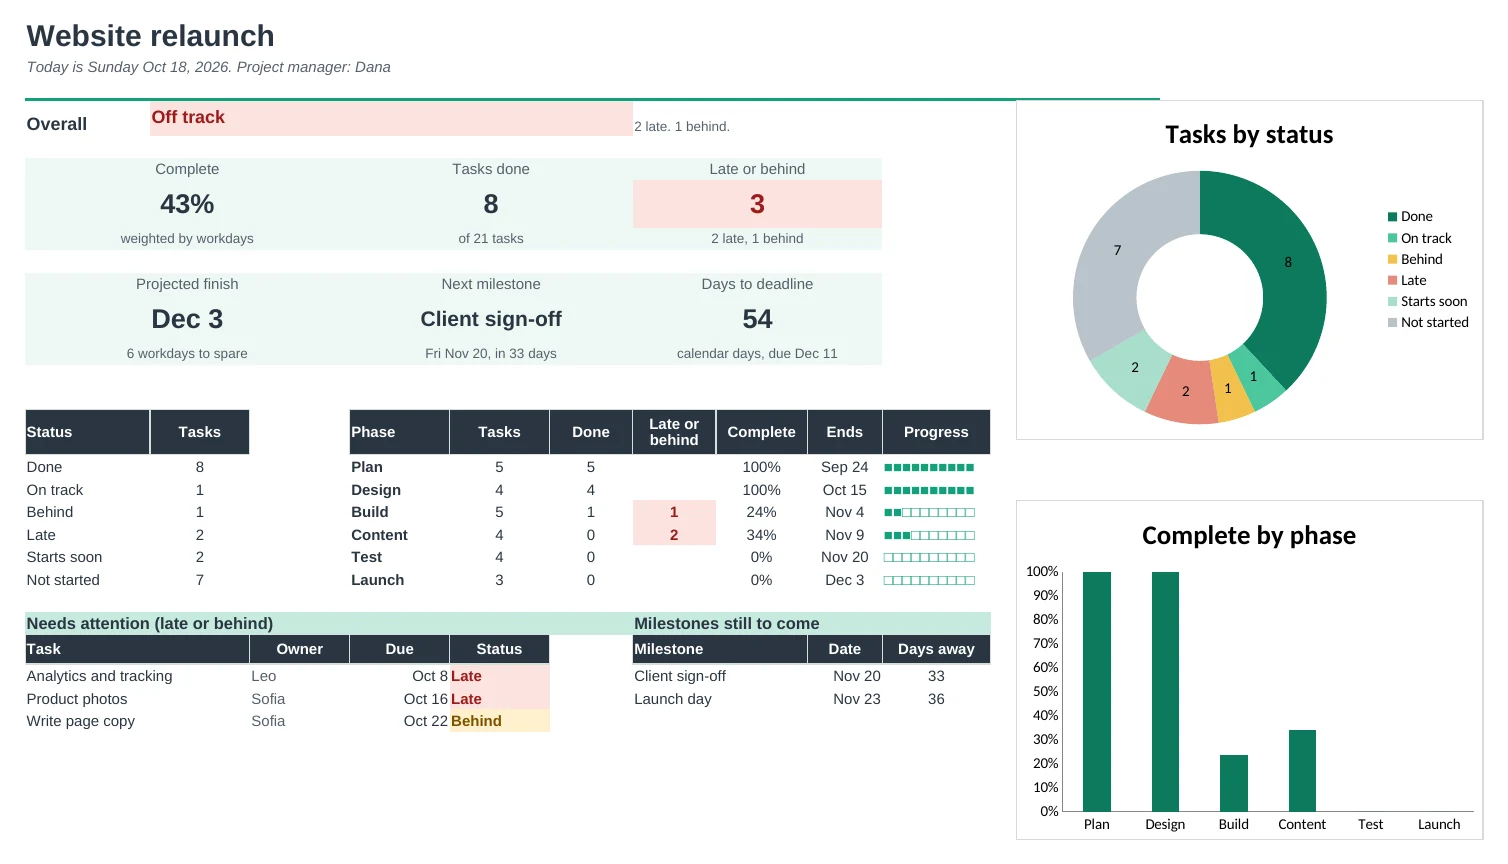
A project plan where dates move themselves: list your tasks once and the Gantt, workload, dashboard and status report follow.
Dates that move when plans change
Say what each task waits for and how many workdays it takes. Start and end dates work themselves out, skipping weekends and your holidays. Push one task back and everything after it moves too.
Type tasks in one place
Every task, owner, phase and % done goes on the Plan tab. The Gantt bars, statuses and totals update from there.
A Gantt you can read at a glance
Bars show what's done, what's still to do and what should be done by now. Milestones are diamonds, today is a yellow column, and you can switch between days and weeks.
See problems early
Each task is marked Late, Behind, On track or Done, so slipping work turns red or amber before the deadline does.
Know who has too much on
Workload counts each person's tasks week by week and flags anyone over the limit you set.
Updates without retyping
The Dashboard shows % complete, projected finish against your deadline and the next milestone. The Status Report is a one-page update ready to print or share.
| Free | Pro |
|---|---|
| Weekly bars for 12 weeks | Day or week view you can scroll |
| Type start and end dates | Dates worked out from what each task waits for |
| · | Skips weekends and your holidays |
| Done, late or in progress | Late, Behind, On track and Done, with slip against the original plan |
| Summary by phase | Dashboard with charts, projected finish and next milestone |
| · | Milestones and a today line on the Gantt |
| · | Workload per person, week by week |
| · | One-page status report |
$19 one-time
7 tabs: Start Here, Dashboard, Plan, Gantt, Workload, Status Report and Setup. You get two copies: one filled in with a sample website project so you can see it working, and a blank one ready for your own.
Get Gantt Chart Pro for $19- Instant download after checkout
- Works in Google Sheets and Excel
- Yours to keep and reuse every year