
Free budget template for Google Sheets
Set a plan for the month, fill in what you actually spend as you go, and the sheet shows where you're over, where you're under and how much is left. It works for one person or a whole household.
| Category | Type | Planned | Actual | Difference |
|---|---|---|---|---|
| Paycheck | Income | $3,200.00 | $3,200.00 | $0.00 |
| Side income | Income | $300.00 | $410.00 | $110.00 |
| Rent or mortgage | Expense | $1,350.00 | $1,350.00 | $0.00 |
| Utilities | Expense | $180.00 | $164.00 | $16.00 |
| Groceries | Expense | $450.00 | $512.00 | -$62.00 |
| Transportation | Expense | $220.00 | $198.00 | $22.00 |
| Insurance | Expense | $160.00 | $160.00 | $0.00 |
| Phone and internet | Expense | $110.00 | $110.00 | $0.00 |
| Eating out | Expense | $150.00 | $205.00 | -$55.00 |
| Fun and hobbies | Expense | $100.00 | $85.00 | $15.00 |
| Debt payments | Expense | $250.00 | $250.00 | $0.00 |
| Savings | Expense | $400.00 | $400.00 | $0.00 |
| Other | Expense | $80.00 | $47.00 | $33.00 |
| Item | Amount |
|---|---|
| Planned income | $3,500.00 |
| Actual income | $3,610.00 |
| Planned spending | $3,450.00 |
| Actual spending | $3,481.00 |
| Left over (planned) | $50.00 |
| Left over (actual) | $129.00 |
| Saved this month | 11.1% |
What's inside
- Planned vs actual for every category, with the difference worked out for you
- Income and expenses in one list, so adding a category is just a new row
- A summary tab with totals, money left over and how much of your income you saved
- Positive differences mean good news: you earned more or spent less than planned
- Works in Google Sheets and Excel
How to use it
Make your copy
Click "Make a copy" to save the template to your own Google Drive. It's yours to edit and nobody else can see it.
Swap in your categories
Rename the categories to match your life. Delete rows you don't need, or add new ones inside the list so the totals still pick them up.
Set your plan
Fill in the Planned column at the start of the month. Start with income, then fixed bills, then everything else.
Track as you go
Once a week, add what you actually spent to the Actual column. Your bank app's monthly totals make this quick.
Check the summary
The Summary tab shows what's left over. If it's negative, the Difference column shows which categories went over.
Tips
Give every dollar a job
Plan until Left over (planned) hits zero. Anything extra goes to savings or debt, so it doesn't quietly disappear.
Use last month as your guide
Your first plan will be a guess. After a month of actuals, set next month's plan from real numbers.
Start a new tab each month
Right-click the tab, choose Duplicate, and rename it for the new month. Clear the Actual column and you're ready.
Questions
Is this budget template really free?
Yes. Copy it to your Google Drive or download the Excel file. There's no sign-up.
Can I use it in Excel?
Yes. Download the .xlsx file below. All the formulas work in Excel too.
How do I add a new category?
Insert a row inside the list, between the first and last category, and copy the Difference formula down. The summary totals include it automatically.
What does a negative difference mean?
For income it means you earned less than planned. For an expense it means you spent more than planned.
Pro version
Household Budget Pro
The whole-year budget that sets itself up from one list of categories and updates every view when you add a purchase.
Set it up once
List your categories and monthly budgets on one Setup tab. The Dashboard, Monthly, Year, Bills and Transactions dropdowns all follow it. Add or rename a category and it shows up everywhere.
Type purchases in one place
Every purchase, bill and paycheck goes on Transactions. Pick a category from the dropdown and the month, totals and charts update themselves.
See your month at a glance
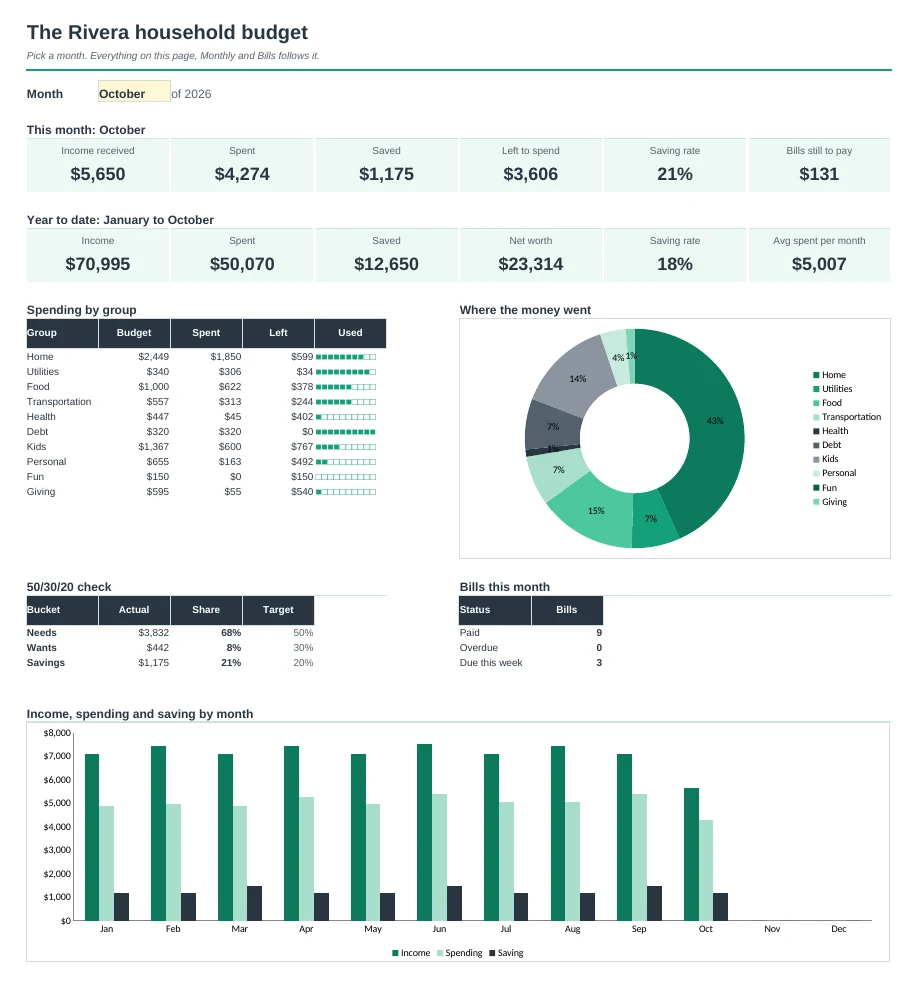
Pick any month on the Dashboard: income, spending, savings, money left, saving rate, a 50/30/20 check and charts of where the money went.
Plan for big costs
Sinking funds work out how much to save each month for Christmas, a trip or the next car, and flag any fund that's falling behind.
Never miss a bill
Bills are marked paid when the payment shows up in your transactions, with overdue and due-this-week flags.
Watch your progress
Year shows every category for all 12 months, and Net Worth charts your accounts and debts month by month.
| Free | Pro |
|---|---|
| One month at a time | All 12 months, pick any month |
| Type amounts into the budget | Type purchases once; totals fill in |
| Summary tab | Dashboard with charts and a 50/30/20 check |
| · | Rollover for categories you choose |
| · | Sinking funds with a monthly target |
| · | Bill tracker with paid and overdue flags |
| · | Net worth tracker with a chart |
| · | Year view: every category, every month |
$19 one-time
9 tabs: Start Here, Dashboard, Monthly, Transactions, Year, Bills, Sinking Funds, Net Worth and Setup. You get two copies: one filled in with a sample household so you can see it working, and a blank one ready for your own numbers.
Get Household Budget Pro for $19- Instant download after checkout
- Works in Google Sheets and Excel
- Yours to keep and reuse every year