
Free profit and loss template for Google Sheets
Type in your monthly sales and costs, and the sheet lays them out as a proper profit and loss statement: revenue, cost of goods, gross profit, operating expenses and net profit for every month and the full year. Margins and quarterly totals are worked out for you.
| Line item | Jan | Feb | Mar | Apr | May | Jun | Jul | Aug | Sep | Oct | Nov | Dec | Year | % of revenue |
|---|---|---|---|---|---|---|---|---|---|---|---|---|---|---|
| Product sales | $7,089.00 | $9,034.00 | $8,701.00 | $9,162.00 | $10,935.00 | $9,529.00 | $8,409.00 | $9,674.00 | $10,511.00 | $12,500.00 | $16,957.00 | $20,773.00 | $133,274.00 | 88.6% |
| Wholesale orders | $0.00 | $1,850.00 | $0.00 | $0.00 | $2,400.00 | $0.00 | $0.00 | $2,100.00 | $3,200.00 | $2,600.00 | $0.00 | $0.00 | $12,150.00 | 8.1% |
| Shipping charged | $390.00 | $497.00 | $479.00 | $504.00 | $601.00 | $524.00 | $462.00 | $532.00 | $578.00 | $688.00 | $933.00 | $1,143.00 | $7,331.00 | 4.9% |
| Refunds and returns | -$93.00 | -$203.00 | -$183.00 | -$115.00 | -$271.00 | -$234.00 | -$172.00 | -$194.00 | -$148.00 | -$152.00 | -$320.00 | -$265.00 | -$2,350.00 | -1.6% |
| Total revenue | $7,386.00 | $11,178.00 | $8,997.00 | $9,551.00 | $13,665.00 | $9,819.00 | $8,699.00 | $12,112.00 | $14,141.00 | $15,636.00 | $17,570.00 | $21,651.00 | $150,405.00 | 100% |
| Materials | $1,529.00 | $2,365.00 | $1,835.00 | $2,052.00 | $2,977.00 | $2,242.00 | $1,897.00 | $2,699.00 | $3,085.00 | $3,471.00 | $3,794.00 | $4,536.00 | $32,482.00 | 21.6% |
| Packaging | $248.00 | $316.00 | $305.00 | $321.00 | $383.00 | $334.00 | $294.00 | $339.00 | $368.00 | $438.00 | $593.00 | $727.00 | $4,666.00 | 3.1% |
| Shipping labels | $461.00 | $587.00 | $566.00 | $596.00 | $711.00 | $619.00 | $547.00 | $629.00 | $683.00 | $812.00 | $1,102.00 | $1,350.00 | $8,663.00 | 5.8% |
| Payment and shop fees | $510.00 | $650.00 | $626.00 | $660.00 | $787.00 | $686.00 | $605.00 | $697.00 | $757.00 | $900.00 | $1,221.00 | $1,496.00 | $9,595.00 | 6.4% |
| Total cost of goods | $2,748.00 | $3,918.00 | $3,332.00 | $3,629.00 | $4,858.00 | $3,881.00 | $3,343.00 | $4,364.00 | $4,893.00 | $5,621.00 | $6,710.00 | $8,109.00 | $55,406.00 | 36.8% |
| Gross profit | $4,638.00 | $7,260.00 | $5,665.00 | $5,922.00 | $8,807.00 | $5,938.00 | $5,356.00 | $7,748.00 | $9,248.00 | $10,015.00 | $10,860.00 | $13,542.00 | $94,999.00 | 63.2% |
| Gross margin | 62.8% | 64.9% | 63% | 62% | 64.4% | 60.5% | 61.6% | 64% | 65.4% | 64.1% | 61.8% | 62.5% | 63.2% | |
| Studio rent | $950.00 | $950.00 | $950.00 | $950.00 | $950.00 | $950.00 | $950.00 | $950.00 | $950.00 | $950.00 | $950.00 | $950.00 | $11,400.00 | 7.6% |
| Part-time wages | $1,484.00 | $1,483.00 | $1,457.00 | $1,435.00 | $1,369.00 | $1,355.00 | $1,365.00 | $1,328.00 | $1,445.00 | $2,273.00 | $3,229.00 | $3,255.00 | $21,478.00 | 14.3% |
| Contractors | $0.00 | $350.00 | $0.00 | $0.00 | $400.00 | $0.00 | $0.00 | $0.00 | $350.00 | $0.00 | $600.00 | $0.00 | $1,700.00 | 1.1% |
| Software and apps | $170.00 | $168.00 | $160.00 | $162.00 | $169.00 | $165.00 | $170.00 | $164.00 | $161.00 | $166.00 | $168.00 | $163.00 | $1,986.00 | 1.3% |
| Advertising | $399.00 | $412.00 | $443.00 | $433.00 | $401.00 | $407.00 | $400.00 | $398.00 | $435.00 | $865.00 | $1,410.00 | $1,093.00 | $7,096.00 | 4.7% |
| Insurance | $78.00 | $78.00 | $78.00 | $78.00 | $78.00 | $78.00 | $78.00 | $78.00 | $78.00 | $78.00 | $78.00 | $78.00 | $936.00 | 0.6% |
| Utilities | $130.00 | $148.00 | $128.00 | $145.00 | $127.00 | $137.00 | $130.00 | $132.00 | $156.00 | $150.00 | $133.00 | $153.00 | $1,669.00 | 1.1% |
| Phone and internet | $95.00 | $95.00 | $95.00 | $95.00 | $95.00 | $95.00 | $95.00 | $95.00 | $95.00 | $95.00 | $95.00 | $95.00 | $1,140.00 | 0.8% |
| Accounting and legal | $0.00 | $0.00 | $650.00 | $0.00 | $0.00 | $0.00 | $0.00 | $0.00 | $0.00 | $0.00 | $0.00 | $180.00 | $830.00 | 0.6% |
| Office supplies | $50.00 | $56.00 | $73.00 | $65.00 | $46.00 | $78.00 | $50.00 | $51.00 | $70.00 | $54.00 | $53.00 | $45.00 | $691.00 | 0.5% |
| Travel and mileage | $30.00 | $48.00 | $36.00 | $49.00 | $40.00 | $43.00 | $62.00 | $44.00 | $48.00 | $58.00 | $34.00 | $33.00 | $525.00 | 0.3% |
| Other expenses | $53.00 | $50.00 | $32.00 | $30.00 | $48.00 | $54.00 | $30.00 | $54.00 | $52.00 | $43.00 | $37.00 | $27.00 | $510.00 | 0.3% |
| Total operating expenses | $3,439.00 | $3,838.00 | $4,102.00 | $3,442.00 | $3,723.00 | $3,362.00 | $3,330.00 | $3,294.00 | $3,840.00 | $4,732.00 | $6,787.00 | $6,072.00 | $49,961.00 | 33.2% |
| Operating profit | $1,199.00 | $3,422.00 | $1,563.00 | $2,480.00 | $5,084.00 | $2,576.00 | $2,026.00 | $4,454.00 | $5,408.00 | $5,283.00 | $4,073.00 | $7,470.00 | $45,038.00 | 29.9% |
| Loan interest | $62.00 | $61.00 | $60.00 | $59.00 | $58.00 | $57.00 | $56.00 | $55.00 | $54.00 | $53.00 | $52.00 | $51.00 | $678.00 | 0.5% |
| Net profit | $1,137.00 | $3,361.00 | $1,503.00 | $2,421.00 | $5,026.00 | $2,519.00 | $1,970.00 | $4,399.00 | $5,354.00 | $5,230.00 | $4,021.00 | $7,419.00 | $44,360.00 | 29.5% |
| Net margin | 15.4% | 30.1% | 16.7% | 25.3% | 36.8% | 25.7% | 22.6% | 36.3% | 37.9% | 33.4% | 22.9% | 34.3% | 29.5% |
| Line | Q1 | Q2 | Q3 | Q4 | Year |
|---|---|---|---|---|---|
| Revenue | $27,561.00 | $33,035.00 | $34,952.00 | $54,857.00 | $150,405.00 |
| Cost of goods | $9,998.00 | $12,368.00 | $12,600.00 | $20,440.00 | $55,406.00 |
| Gross profit | $17,563.00 | $20,667.00 | $22,352.00 | $34,417.00 | $94,999.00 |
| Gross margin | 63.7% | 62.6% | 64% | 62.7% | 63.2% |
| Operating expenses | $11,379.00 | $10,527.00 | $10,464.00 | $17,591.00 | $49,961.00 |
| Operating profit | $6,184.00 | $10,140.00 | $11,888.00 | $16,826.00 | $45,038.00 |
| Net profit | $6,001.00 | $9,966.00 | $11,723.00 | $16,670.00 | $44,360.00 |
| Net margin | 21.8% | 30.2% | 33.5% | 30.4% | 29.5% |
| Month | Revenue | Gross profit | Gross margin | Operating expenses | Net profit | Net margin | Profit so far | Revenue vs last month |
|---|---|---|---|---|---|---|---|---|
| Jan | $7,386.00 | $4,638.00 | 62.8% | $3,439.00 | $1,137.00 | 15.4% | $1,137.00 | |
| Feb | $11,178.00 | $7,260.00 | 64.9% | $3,838.00 | $3,361.00 | 30.1% | $4,498.00 | 51.3% |
| Mar | $8,997.00 | $5,665.00 | 63% | $4,102.00 | $1,503.00 | 16.7% | $6,001.00 | -19.5% |
| Apr | $9,551.00 | $5,922.00 | 62% | $3,442.00 | $2,421.00 | 25.3% | $8,422.00 | 6.2% |
| May | $13,665.00 | $8,807.00 | 64.4% | $3,723.00 | $5,026.00 | 36.8% | $13,448.00 | 43.1% |
| Jun | $9,819.00 | $5,938.00 | 60.5% | $3,362.00 | $2,519.00 | 25.7% | $15,967.00 | -28.1% |
| Jul | $8,699.00 | $5,356.00 | 61.6% | $3,330.00 | $1,970.00 | 22.6% | $17,937.00 | -11.4% |
| Aug | $12,112.00 | $7,748.00 | 64% | $3,294.00 | $4,399.00 | 36.3% | $22,336.00 | 39.2% |
| Sep | $14,141.00 | $9,248.00 | 65.4% | $3,840.00 | $5,354.00 | 37.9% | $27,690.00 | 16.8% |
| Oct | $15,636.00 | $10,015.00 | 64.1% | $4,732.00 | $5,230.00 | 33.4% | $32,920.00 | 10.6% |
| Nov | $17,570.00 | $10,860.00 | 61.8% | $6,787.00 | $4,021.00 | 22.9% | $36,941.00 | 12.4% |
| Dec | $21,651.00 | $13,542.00 | 62.5% | $6,072.00 | $7,419.00 | 34.3% | $44,360.00 | 23.2% |
| Average | $12,533.75 | $7,916.58 | 63.2% | $4,163.42 | $3,696.67 | 29.5% | ||
| Highest month | $21,651.00 | $13,542.00 | 65.4% | $6,787.00 | $7,419.00 | 37.9% | ||
| Lowest month | $7,386.00 | $4,638.00 | 60.5% | $3,294.00 | $1,137.00 | 15.4% |
What's inside
- A standard P&L layout: revenue, cost of goods, gross profit, operating expenses, operating profit and net profit
- All 12 months side by side, with a year total and each line as a percent of revenue
- Gross margin and net margin for every month, so you can see if growth is really making money
- A quarterly view for checking in every three months
- A monthly trend tab with profit so far this year, highest and lowest months, and revenue change month to month
- Works in Google Sheets and Excel
How to use it
Make your copy
Click "Make a copy" to save the statement to your Google Drive, or download the Excel file.
Rename the line items
Change the sample lines to match your business. To add a line, insert a row inside the right group, above its total row, so the total picks it up. Delete lines you don't need.
Fill in each month
At the end of each month, add up each line from your bank statements, sales reports or bookkeeping and type the totals in that month's column. Enter refunds as negative numbers.
Read the results
Gross profit tells you what your products or services earn before overhead. Net profit is what's left after everything. The % of revenue column shows where the money goes.
Check the trend
Look at the Quarters and Monthly Trend tabs to compare months, spot your slow season and see your profit so far this year.
Tips
Know what counts as cost of goods
Cost of goods is what you spend to make or deliver each sale: materials, packaging, shipping and sales fees. Rent, software and ads go under expenses because you pay them even in a month with no sales.
Watch margin, not just sales
A busy month can still be a thin one. If revenue goes up but gross margin goes down, check your prices and your shipping and fee costs.
Pay yourself on purpose
If you're a sole owner, owner draws usually aren't an expense on a P&L. Ask your accountant how to treat your own pay so your profit isn't understated.
Use it alongside your books
This is a monthly statement, not a ledger. Record day-to-day transactions in a bookkeeping sheet or app, then copy the monthly totals here.
Questions
What is a profit and loss statement?
It's a report of what a business earned and spent over a period, ending in profit or loss. It's also called a P&L or an income statement. This template shows one for each month and for the whole year.
What's the difference between gross profit and net profit?
Gross profit is revenue minus the direct cost of what you sold. Net profit is what's left after you also take out operating expenses like rent, wages and advertising, plus loan interest.
Can I use this P&L for my taxes?
It's a good summary to bring to tax time, but it isn't a tax form and it doesn't work out tax. Tax rules for what you can deduct vary, so check with an accountant or tax preparer.
How is this different from a bookkeeping template?
A bookkeeping sheet records each transaction as it happens. A P&L takes the monthly totals and shows them as a statement. Many small businesses use both.
Does it work for a service business?
Yes. Rename the revenue lines to your services. If you don't have product costs, leave cost of goods at zero or use it for direct costs like subcontractors on client jobs.
Is it free?
Yes. Copy it to Google Sheets or download the Excel version. No sign-up needed.
Pro version
Profit and Loss Pro
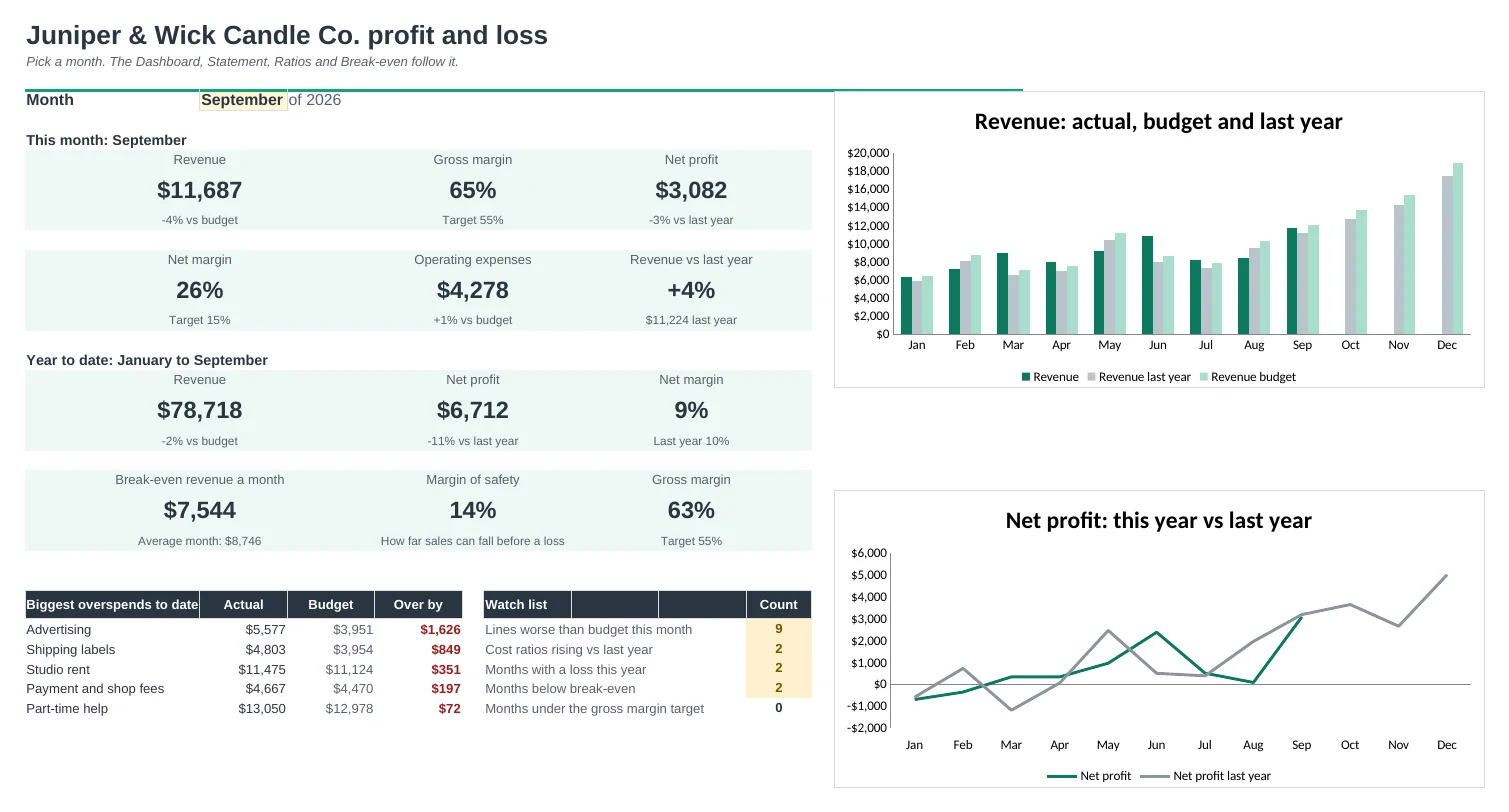
Type each month's totals and get a one-page statement with budget, last year and year to date, plus margins, break-even and trends.
A statement you can hand over
Pick a month and Statement lays out that month and the year to date on one printable page: actual, budget, the difference and last year for every line.
Budget vs actual at a glance
Lines that are off budget by more than your limit turn red or green. Costs under budget count as good news; sales under budget don't.
A budget in minutes
Budget starts as last year plus the growth you set for sales and for fixed costs. Type over any month you want to plan differently.
Know your break-even
Mark each cost fixed or variable and see the sales you need each month to cover everything, how far above it you are, and what a price or cost change would do.
Spot creeping costs
Ratios shows your margins against your targets every month and flags any cost taking a bigger share of each sales dollar than last year.
See the trend
Revenue and profit against last year and budget, month by month and quarter by quarter, with charts on the Dashboard and Trends.
| Free | Pro |
|---|---|
| 12-month P&L you type into | Type totals once; every report fills in |
| Margins for each month | Margins against your own targets, with status flags |
| Quarterly totals | Quarters compared with last year |
| · | Budget vs actual with variance flags |
| · | Last year comparison for the month and year to date |
| · | Printable one-page statement for any month |
| · | Break-even, margin of safety and a what-if |
| · | Cost ratios rising or falling vs last year |
| · | Dashboard with charts and a watch list |
$19 one-time
11 tabs: Start Here, Dashboard, Statement, Monthly, Ratios, Break-even, Trends, Actuals, Budget, Last Year and Setup. You get two copies: one filled in with a sample small business so you can see it working, and a blank one ready for your own numbers.
Get Profit and Loss Pro for $19- Instant download after checkout
- Works in Google Sheets and Excel
- Yours to keep and reuse every year